
Public Dashboards
Current and longitudinal reports concerning Rice’s students, faculty, staff, alumni, and financial resources are available to the public. For additional information, please contact us.
Filter by type
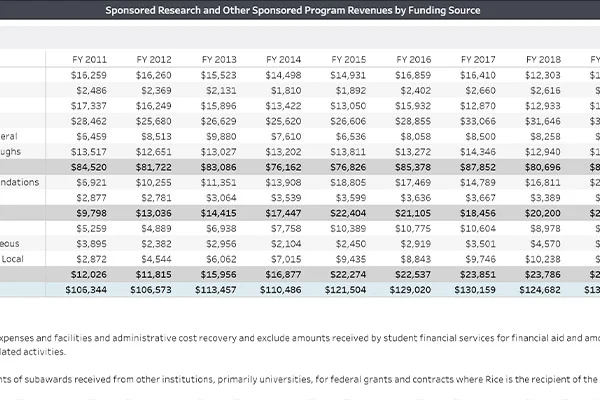
Sponsored Research
This report displays the end-of-fiscal year sponsored research expenditures by federal, foundations, and other funding sources for the last ten fiscal years.
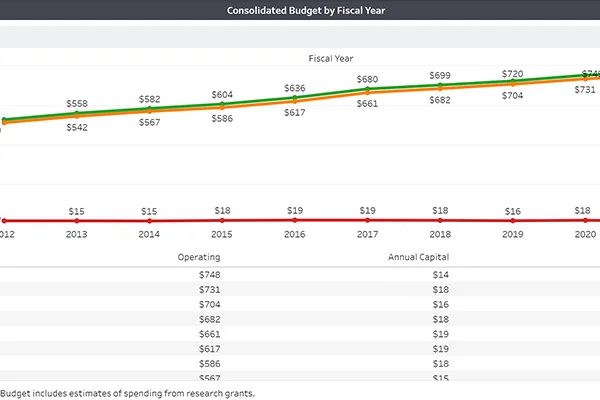
Consolidated Budget
This report includes the annual capital budget, operating budget, and total budget for the last 10 years.
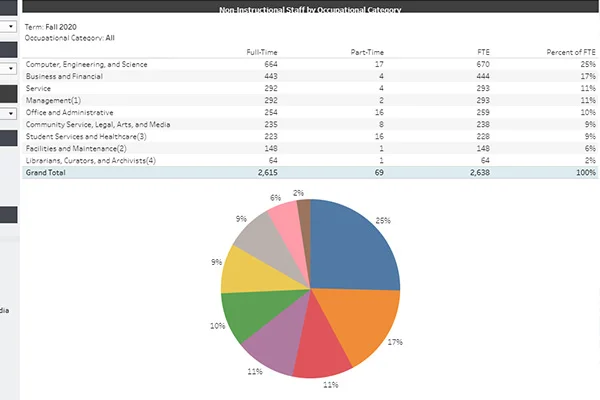
Staff
This report shows the headcount and FTE of non-instructional staff by occupational categories, gender, and citizenship and race.
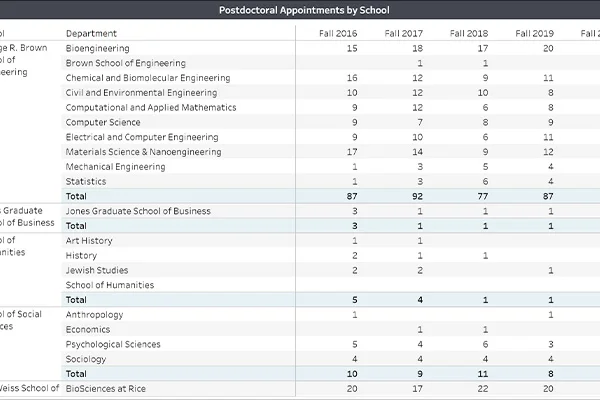
Postdoctoral Appointments
This report is a historical view of postdoctoral appointments by school and department, center, or institute.
Faculty Attributes
This report shows faculty headcount by school, gender, and race/ethnicity and international status.
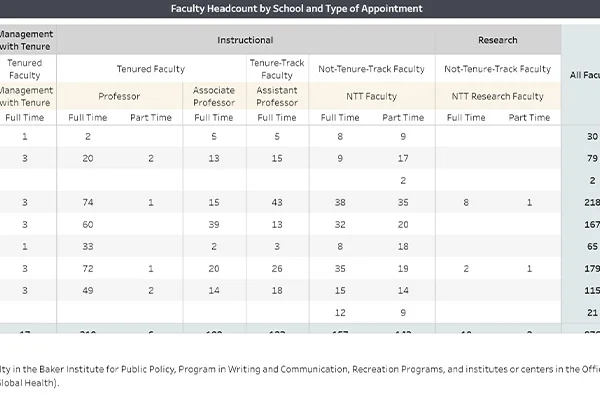
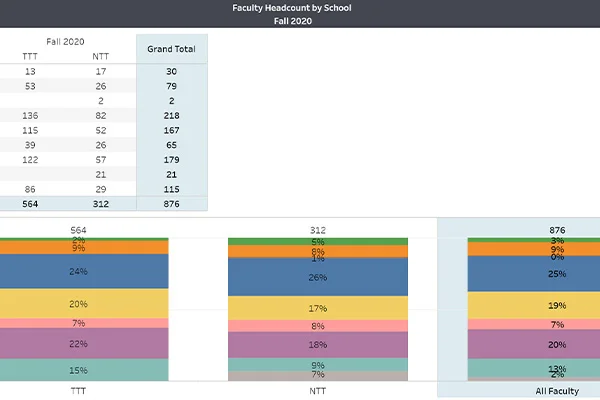
Faculty Appointments
This report shows faculty headcount by school, appointment type, tenure status, and academic rank.

Geographic Distribution: International
This report shows the geographic distribution of alumni internationally.
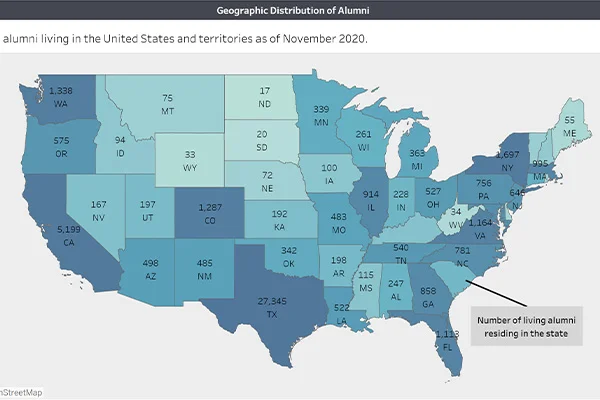
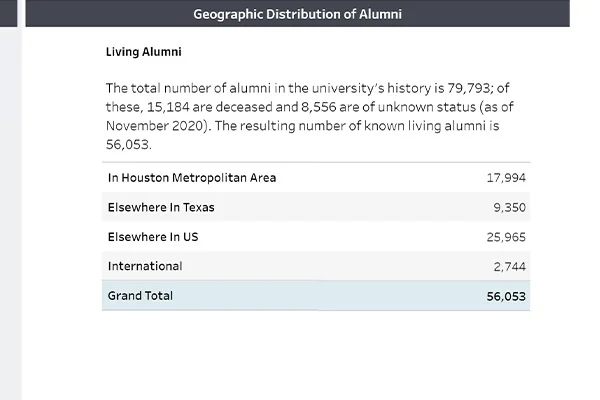
Geographic Distribution Summary
This report shows the number of alumni distributed in geographic locations in the U.S. and around the world.
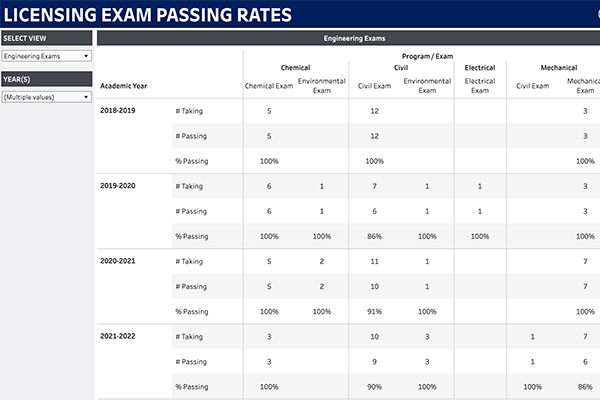
Licensing Exam Passing Rates
The Licensing Exam Passing Rates report provides statistics on the number of students who attempted and passed two sets of tests. The first is the Fundamentals in Engineering Exam of the National Council for Examiners for Engineering and Surveying (NCEES) necessary to become a licensed Professional Engineer. The second is the Educator Certification Exam of the Texas Education Agency for students pursuing a high school teaching career.
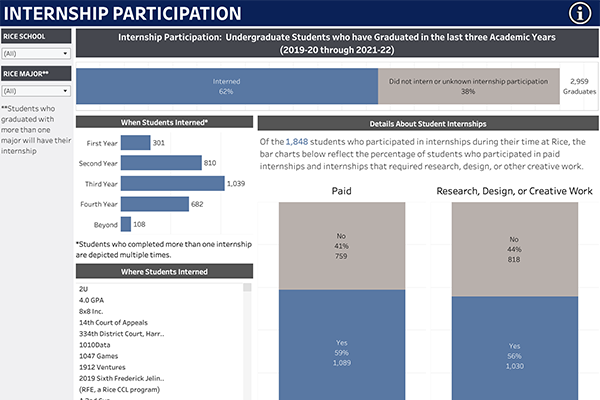
Internship Participation
The Internship Participation report provides the percentage of graduates that interned sometime during their time at Rice. It also lists the Internship Companies that hosted the students, as well as details about their internships.